Red days stacking up for $BTC.
By Maxime Laurent · 2025-12-09 12:17
Red days stacking up for $BTC.
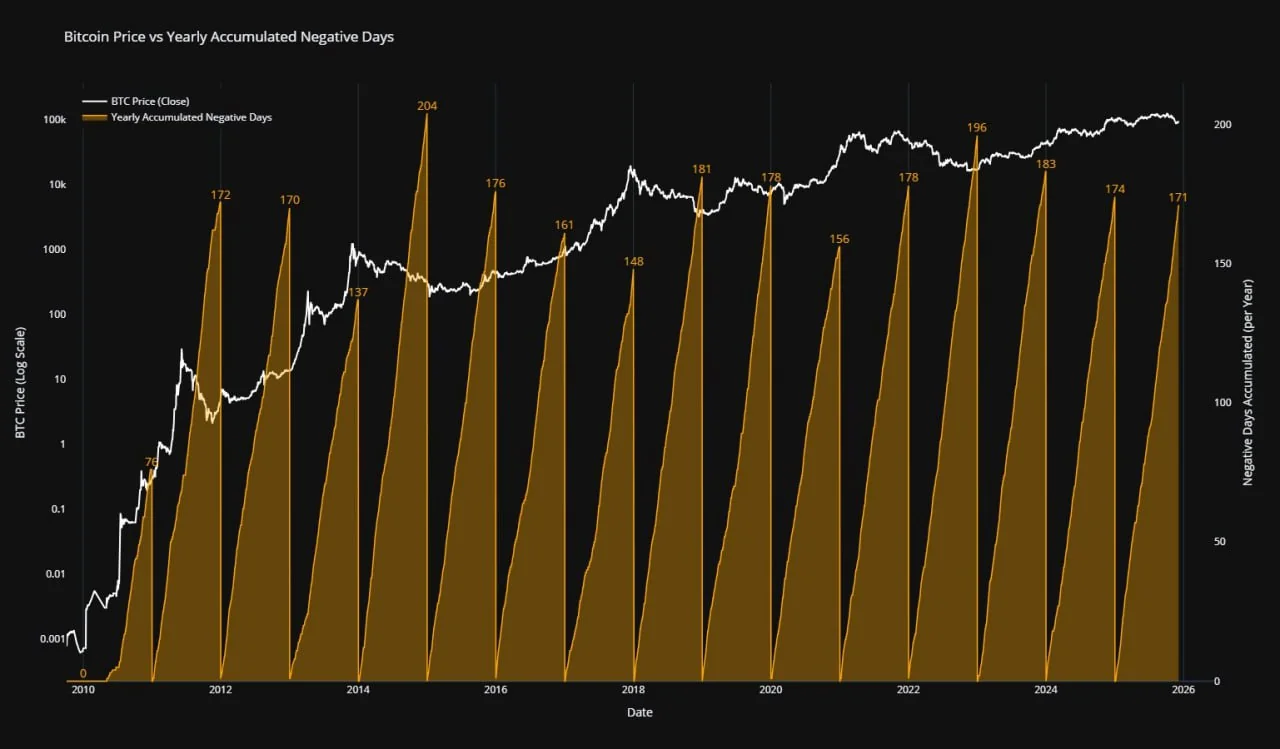
$BTC has already logged 171 negative days this year — almost exactly its long-term average.
When I look at those little “red needles” on the charts, it always reminds me how cyclical this game is. One year it feels like the sky is falling, another year we’re sipping rosé on the balcony watching candles go vertical. Cette fois-ci, we’re sitting right on the historical mean: around 170 red days per year.
For context: the worst stretch ever was back in 2014 with 204 red closes — pure bear-market melancholy. The shortest? 2010, only 76 days in the red, when $BTC was still a wild baby learning to walk.
So 171 this year feels… normal. Not great, not terrible — just the usual market breathing in and out. And honestly, I prefer when things follow the rhythm of past cycles; it keeps me grounded here under the southern sun ☀️.
If the pattern holds, we might be closer to emotional exhaustion than to true danger. Red days come and go, but the long arc of $BTC has always been patient.
#Bitcoin #BTC #MarketCycle #CryptoAnalysis #RedDays
Disclaimer: This content is for informational purposes only and not financial advice.