Brandt flags a possible BTC pullback.
By Maxime Laurent · 2025-12-02 08:29
Brandt flags a possible BTC pullback.
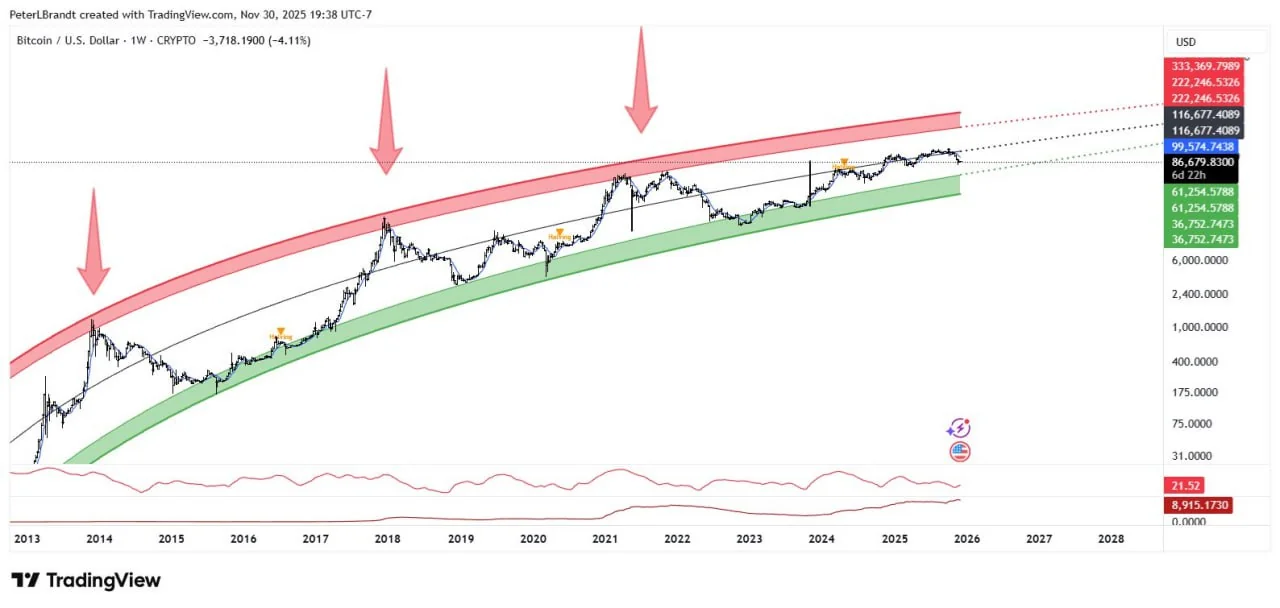
Price hits the top of his long-term curve model.
Looking at Peter Brandt’s fresh logarithmic curves tonight, with the sky turning orange over the côte, I felt that familiar mix of caution and curiosity. According to his model, $BTC has pushed right into the upper boundary — a zone that historically tends to trigger corrections. Ça sent la tension.
On the downside, the green support zone sits somewhere around $40k–45k, while the upper edge of the model runs below $70k. In other words, if the market cools off, there’s room — a wide one — for $BTC to breathe before finding its footing again.
But here’s the thing: models tell us where the walls are, not how hard we’ll hit them. Walking along the promenade, I kept thinking how often $BTC dances around these boundaries before choosing a real direction. Whether we get a clean pullback or just a tease depends on sentiment, liquidity, and that spark of market psychology no chart truly captures.
Stay nimble, stay patient — and don’t let the waves spook you. 🌊✨
#Bitcoin #BTC #PeterBrandt #MarketAnalysis #CryptoCharts #CryptoFriture
Disclaimer: This content is for informational purposes only and not financial advice.